
Imagine it’s Monday morning.
NovaMab’s commercial director wants to understand how the product performed during the previous quarter.
Territory A recorded 900 prescriptions. Territory B recorded 450.
The sales report is ready. The CRM report shows customer interactions. Another spreadsheet contains territory assignments, while market research provides estimates of the eligible patient population.
All the information seems to be available.
So why does answering one relatively simple business question still require so much work?
Welcome to the traditional world of pharmaceutical commercial analytics.
Before everything became a platform
Pharmaceutical companies have been analyzing commercial performance long before cloud data platforms, modern dashboards, and AI.
Depending on the organization and period, analysts worked with spreadsheets, databases, enterprise data warehouses, CRM systems, and specialized reporting tools.
They tracked product sales, prescribing patterns, customer segments, territory performance, and commercial activity.
A typical reporting process might involve extracting information from several systems, applying business rules, reconciling differences, and assembling a report for commercial management.
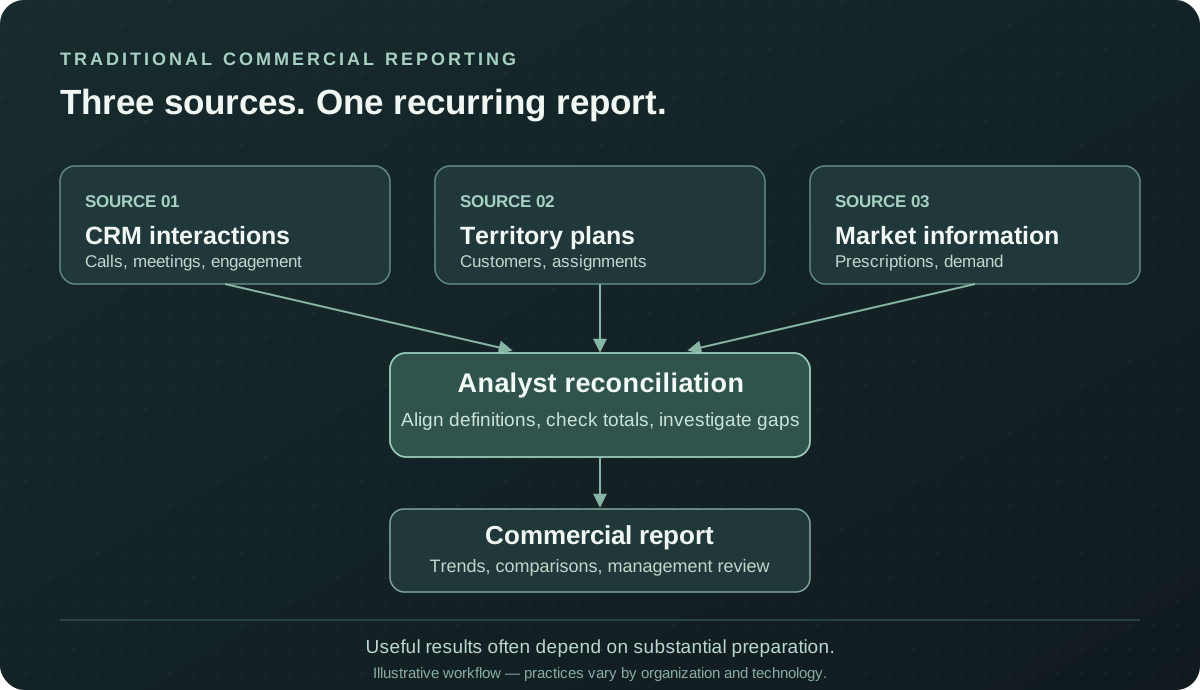
Different sources contribute to a commercial report. When systems are not fully integrated, analysts often bridge the gaps.
This approach wasn’t necessarily unsophisticated.
A well-designed spreadsheet could contain years of business knowledge. Experienced analysts often understood market conditions, customer definitions, and reporting exceptions better than anyone else.
The limitation wasn’t always the tools.
It was the increasing complexity of the questions those tools were expected to answer.
The spreadsheet did its job. Then came the next question.
Let’s return to NovaMab.
The quarterly report shows that Territory A generated twice as many prescriptions as Territory B.
That’s useful information.
But the commercial director wants to know why.
The analyst checks the market research data and discovers that Territory A has a much larger estimated eligible patient population.
Now the director has another question.
Does Territory B have fewer prescriptions because of its smaller market, or are access restrictions, product availability, specialty mix, or other factors involved?
The CRM data may provide information about commercial engagement.
Customer master data may describe the HCP population.
Another report may provide product-level or market-level trends.
Each answer creates another question.
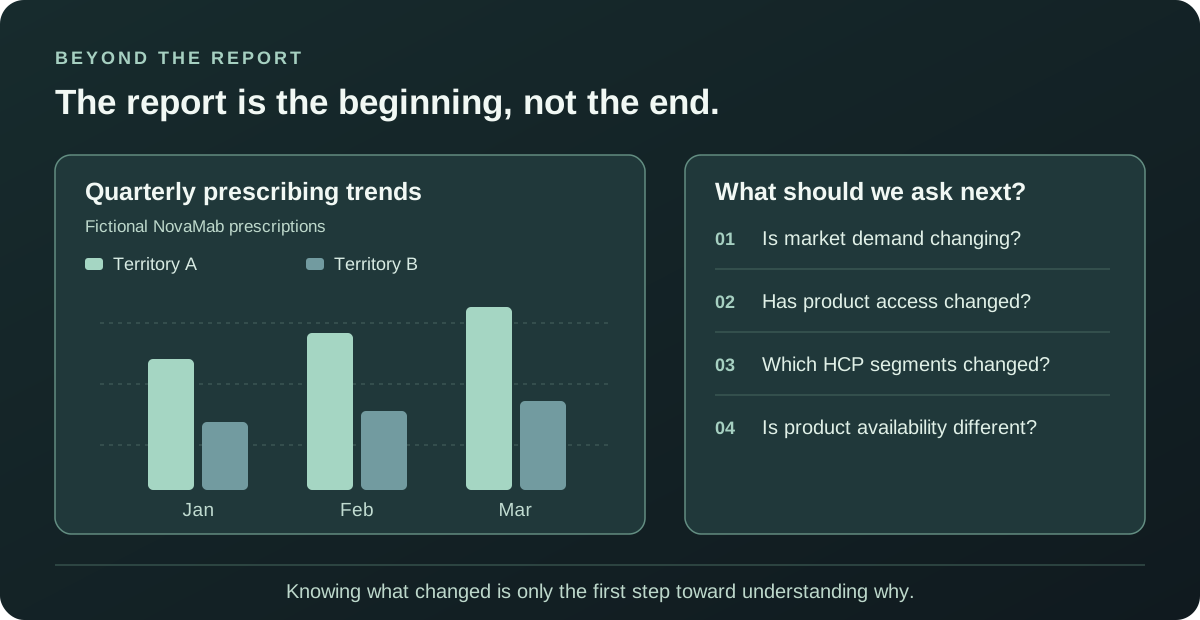
An accurate report can show what changed. Understanding why often requires additional context and investigation.
The spreadsheet hasn’t failed.
The analytical question has become more demanding.
Where traditional reporting begins to strain
When the number of sources, markets, products, and reporting periods increases, several practical problems become more visible.
Time spent preparing data. Analysts may spend substantial effort collecting extracts, aligning identifiers, checking totals, and updating recurring reports before they can begin investigating the business question.
Different definitions. One report might classify HCPs by their current territory, while another uses the territory assignment that was valid when an interaction occurred. Both approaches can be legitimate, but they answer different questions.
Historical snapshots. A monthly or quarterly report may describe an earlier version of the market. By the time someone asks a follow-up question, newer information may be available elsewhere.
Limited flexibility. A report designed to answer a familiar question may be difficult to adapt when management wants to explore a different segment, time period, or market assumption.
These difficulties don’t disappear merely by replacing spreadsheets with dashboards. Poorly defined business rules and inconsistent source data can follow an organization onto even the newest technology platform.
From preparing reports to exploring decisions
Modern data engineering and analytics platforms offer ways to reduce some of that friction.
Instead of repeatedly rebuilding relationships between customer, product, activity, and market datasets, teams can establish governed data pipelines, shared definitions, and reusable analytical models.
Dashboards can make information more accessible. Automated validation can detect inconsistencies. Historical snapshots can preserve the context needed to interpret previous results.
AI may assist with querying, summarization, or identifying patterns, provided the underlying data and its use are appropriately governed.
But technology doesn’t replace the commercial analyst.
The analyst still needs to understand the market, question unusual patterns, recognize incomplete information, and distinguish plausible explanations from demonstrated causes.
The goal is to spend less time repeatedly assembling the same information and more time understanding what that information means.
The idea to take away
Traditional pharmaceutical commercial reporting created the foundation for modern customer analytics.
Spreadsheets, CRM systems, data warehouses, and business expertise are not obsolete simply because newer technologies exist.
The challenge is that commercial questions increasingly cross the boundaries between datasets, functions, markets, and time periods.
The real transition is from repeatedly preparing reports to continuously exploring better questions.
And that introduces another problem.
What happens when different teams connect their information but still arrive at different answers?
That’s where our next article begins: Five Dashboards. Five Different Answers.