
It’s time for NovaMab’s quarterly business review.
The commercial director asks a seemingly straightforward question:
“How is our product doing?”
The sales team opens its dashboard. Marketing has prepared another. Finance brings its own numbers, while market access has a different view of the launch.
Medical Affairs maintains a separate, appropriately governed view of scientific inquiries.
Everyone has information about NovaMab.
But they aren’t necessarily answering the same question.
One product. Five different perspectives.
Let’s imagine five reports from our fictional NovaMab organization.
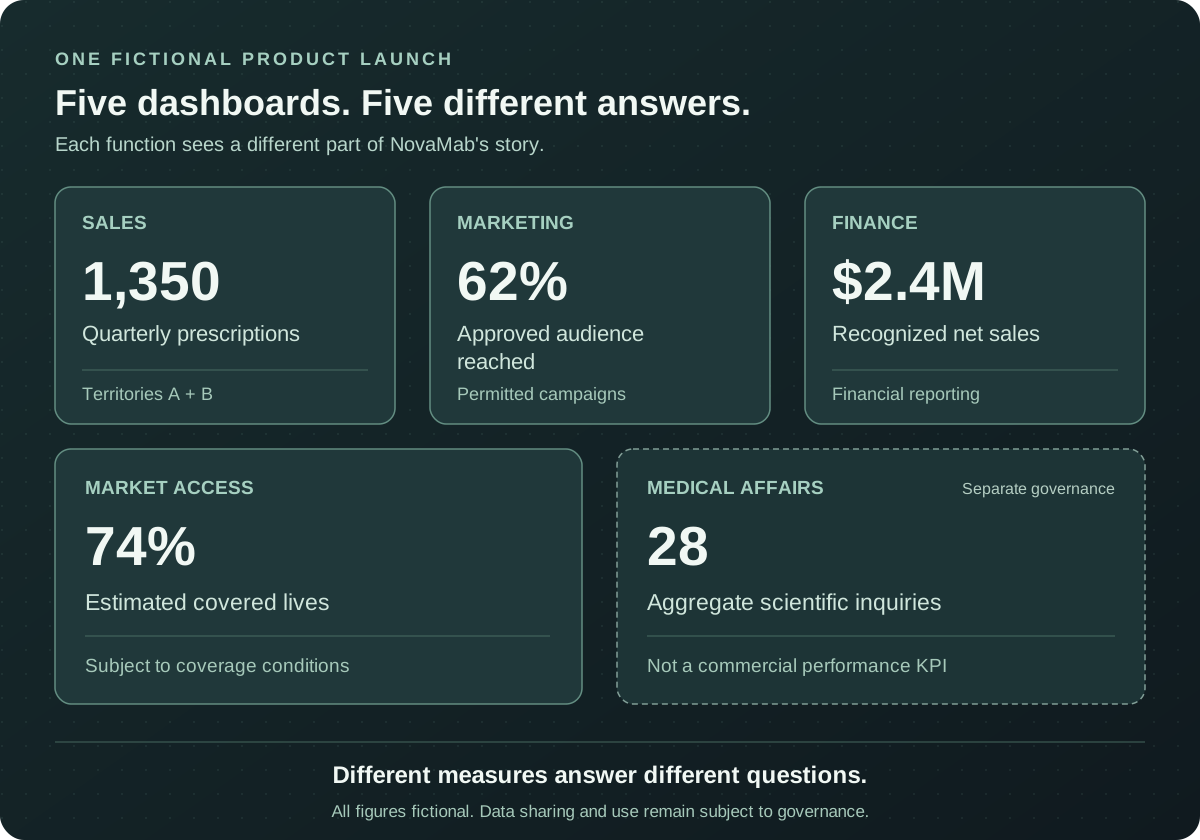
Five perspectives on the same fictional product. The figures measure different things and should not be treated as interchangeable performance indicators.
Sales: Are prescriptions growing?
The sales dashboard reports 1,350 prescriptions during the quarter.
That’s consistent with the figures from our previous articles: 900 prescriptions in Territory A and 450 in Territory B.
The sales team can examine prescribing trends, product performance, territories, and relevant customer segments using appropriately sourced and permitted data.
But prescription volume alone cannot establish how many unique patients received treatment, why prescribing changed, or whether every territory has comparable opportunity.
Marketing: Are we reaching the intended audience?
The marketing dashboard reports that 62% of its approved target audience was reached through permitted campaigns during the quarter.
That tells us something about campaign delivery.
It doesn’t tell us whether those interactions changed prescribing behaviour—or whether every interaction was equally useful.
Marketing activity, audience reach, and prescription volume are related business subjects, but they are not the same metric.
Finance: What revenue did we recognize?
The finance dashboard reports $2.4 million in recognized net sales.
That number reflects financial recognition and applicable accounting adjustments.
It need not move in perfect proportion to prescriptions during the same quarter. Distribution timing, contractual arrangements, pricing adjustments, and other factors may affect the relationship.
A financial result and a prescription count can both be accurate without being directly reconcilable through simple multiplication.
Market access: Can eligible patients obtain the medicine?
The market access dashboard estimates that 74% of the relevant population has coverage for NovaMab under defined conditions.
That’s a different perspective again.
Coverage doesn’t guarantee that an individual patient can obtain treatment. Restrictions, reimbursement procedures, affordability, and local healthcare arrangements may still affect access.
The definition of coverage must also be clear: the population, market, products, plans, and restrictions included can change the reported percentage.
Medical Affairs: What scientific questions are being raised?
A separately governed Medical Affairs report records 28 scientific inquiries during the quarter.
These inquiries may help Medical Affairs understand information needs and support appropriate scientific exchange.
They are not a commercial conversion measure, a proxy for promotional effectiveness, or something that should be matched casually with individual prescribing activity.
Medical Affairs operates under distinct scientific and compliance responsibilities. Its information should only be shared or analyzed across functions where the purpose, permissions, privacy requirements, and governance allow it.
Different answers don’t always mean conflicting data
Our five reports aren’t necessarily contradictory.
They describe different aspects of the same fictional launch: prescribing, campaign reach, revenue, coverage, and scientific information needs.
Each dashboard serves a legitimate purpose, provided its measures are properly defined and used.
The mistake would be to treat them as five versions of one universal measure of success.
A commercial review becomes more useful when people ask what each number actually represents before drawing conclusions from it.
But what if two dashboards report the same metric?
Now imagine a more familiar problem.
The national sales dashboard reports 1,350 NovaMab prescriptions for the quarter.
A regional analyst has an earlier extract showing only 1,260 prescriptions for exactly the same territories and period.
Which number is correct?
In our fictional example, both extracts use the same underlying metric and territorial definitions, but the earlier report was produced before 90 late-arriving records became available.
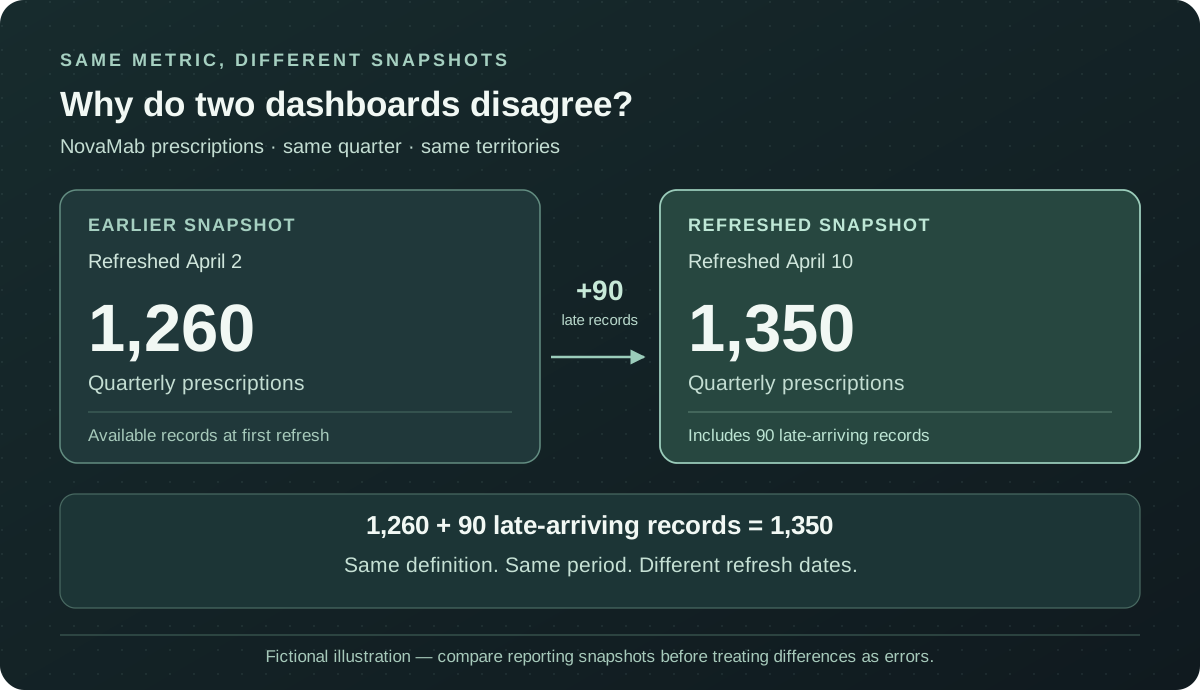
The later fictional snapshot includes 90 additional records. A matching metric name doesn’t guarantee comparable reporting snapshots.
Not every discrepancy is this straightforward.
Two systems might define an active customer differently. One might use the territory assignment valid today, while another uses the assignment valid at the time of an interaction.
One dashboard might report prescriptions written, while another reports prescriptions dispensed. Those are different events, even if both appear under a broad heading such as “prescriptions.”
Simply forcing two dashboards to show the same number could hide a legitimate distinction—or introduce an error.
The missing piece: shared meaning
Connected analytics doesn’t begin by placing every dataset in the same database.
It begins by establishing what the information means.
For each important metric, teams need a clear definition, a reporting period, the population or geography included, the source, and an explanation of relevant exclusions and refresh timing.
They also need to understand who owns the metric and where its use is permitted.
That last point is particularly important in pharmaceutical analytics. Connecting data technically does not automatically make every combination of data appropriate, lawful, or useful.
A shared analytical model can reduce repeated reconciliation while preserving different measures for different business purposes.
The objective is consistent interpretation, not artificial agreement.
The idea to take away
Five dashboards can provide five different, entirely legitimate perspectives on one pharmaceutical market.
Two dashboards can also show different values for what appears to be the same metric because their definitions, reporting periods, source coverage, or refresh dates differ.
Before connecting data, we need to understand its meaning and limitations.
A connected view becomes valuable when we can explain both where numbers agree and why they differ.
So what changes when the appropriate datasets really are connected—with their definitions, history, and permitted uses intact?
That’s the question for our next article: What Changes When Customer Data Connects?