
NovaMab’s commercial team has plenty of reports.
Its sales dashboard records 1,350 prescriptions for the quarter. Customer master data describes the healthcare professionals (HCPs) in each territory. CRM reports show permitted commercial interactions. Market research estimates the eligible patient population.
Each dataset answers a useful question. But the team keeps asking questions that cross the boundaries between them.
What changes when those datasets can be examined together?
From separate reports to a connected view
Consider the question we encountered earlier: why does Territory A record twice as many prescriptions as Territory B?
A prescribing report shows the difference. A customer report tells us that both territories have 200 HCPs. A market estimate suggests that their eligible patient populations are very different.
Connecting these facts doesn’t automatically explain the difference. It does let analysts compare them without repeatedly rebuilding a collection of spreadsheets.
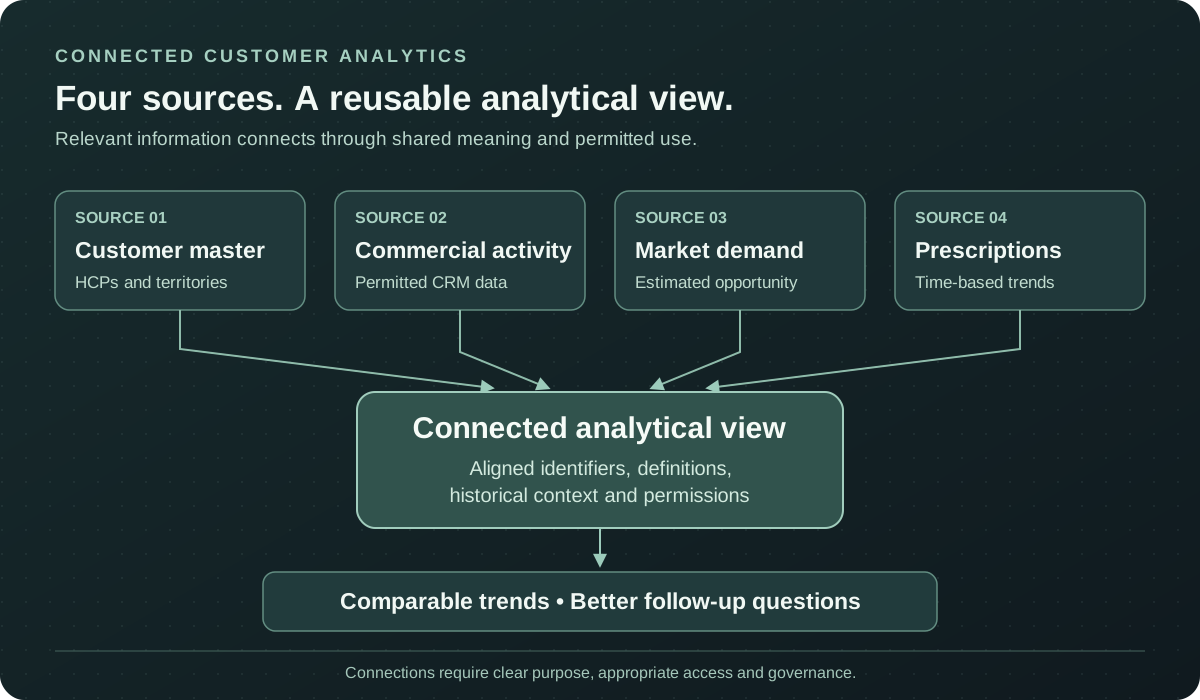
Connecting data means making relevant relationships and definitions reusable—not combining every available dataset without restriction.
In practice, that requires more than putting files in one location. Customer identifiers must be reliable. Product and geography definitions must align. Territory assignments can change over time. Each source has its own reporting frequency and limitations.
A connected view is useful precisely because those details become visible and manageable.
The same territories, seen in context
Let’s bring together the fictional figures we’ve used throughout this series.
Both NovaMab territories have 200 HCPs. During the quarter, Territory A records 900 prescriptions and Territory B records 450. Their estimated eligible populations are 12,000 and 3,000 respectively.
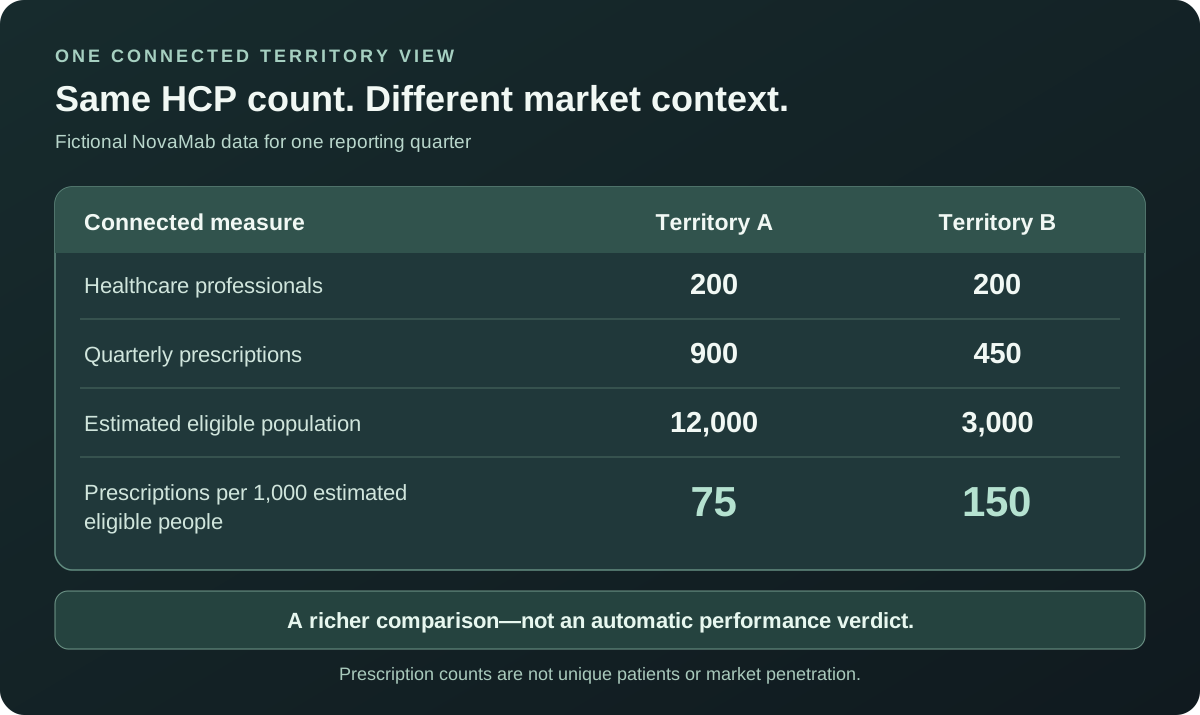
Illustrative data: 75 versus 150 prescriptions per 1,000 estimated eligible people. These are not patient penetration rates or measures of treatment success.
Looking at prescriptions alone, Territory A is twice the size of Territory B. Relative to the estimated eligible population, the comparison reverses.
Neither observation establishes which territory is performing better. Different disease patterns, prescribing practices, access conditions, and the uncertainty of market estimates may all matter.
But we now have a more informative starting point—and a clear list of what we still need to investigate.
New questions become possible
Once appropriate customer, market, and activity data can be examined using shared definitions, the team can ask questions that were awkward to answer with isolated reports.
For example, do prescribing trends differ by HCP specialty after accounting for territory changes? Are permitted commercial interactions distributed across the intended audience? Did a shift in market access coincide with a change in prescribing patterns?
These are analytical questions, not proof of cause and effect. A rise in prescriptions after a commercial interaction does not establish that the interaction caused it. Other market events may have occurred at the same time.
Nor should every available dataset be joined. Medical Affairs data, patient information, and other sensitive or separately governed sources require their own purpose, permissions, and safeguards. Technical ability is not authorization.
The quiet advantage: answering follow-up questions
The biggest change may be less dramatic than a new dashboard.
Imagine the commercial director asks for prescribing trends by territory. A connected analytical model provides the answer. Then comes a follow-up: show the same trend using the territory assignments that were valid at the time, rather than today’s organizational structure.
If historical assignments, source dates, and metric definitions have been preserved, analysts can investigate that question without starting from scratch.
Reusable definitions also make disagreements easier to resolve. Teams can see which source, snapshot, exclusions, and assumptions produced each result.
That’s the difference between a collection of reports and an analytical foundation.
The idea to take away
Connected customer analytics doesn’t mean that every number belongs in one dashboard or that all business functions should share all their data.
It means relevant, permitted information can be interpreted together—with clear definitions, history, and limitations—so that a question can lead naturally to the next question.
Connections make richer analysis possible. They don’t make interpretation optional.
So far, we’ve been looking backward: what happened, where, and under what conditions?
What if NovaMab’s team wants to explore a possible future instead?
That’s where our next article begins: From What Happened to What If?