
NovaMab’s commercial team can now examine prescribing, customer, and market information together. It understands which definitions were used, when the data was refreshed, and how the two fictional territories differ.
That makes it easier to answer questions about the previous quarter.
But the next business review introduces a different question:
What might happen if the market changes?
Perhaps access to NovaMab improves in Territory B. Perhaps product availability becomes constrained. What would each situation mean for the questions the team should investigate?
A historical dashboard cannot answer those questions on its own. This is where scenarios become useful.
Start with the world we already know
Let’s keep our familiar fictional numbers. During the previous quarter, Territory A recorded 900 prescriptions among an estimated 12,000 eligible people. Territory B recorded 450 prescriptions among an estimated 3,000 eligible people. Both territories had 200 HCPs.
These figures give us a starting point—not an explanation of why the territories differ and certainly not a prediction of next quarter.
For a scenario exercise, we need to decide which conditions remain unchanged, which assumptions we want to vary, and how a change in one part of the market might affect another.
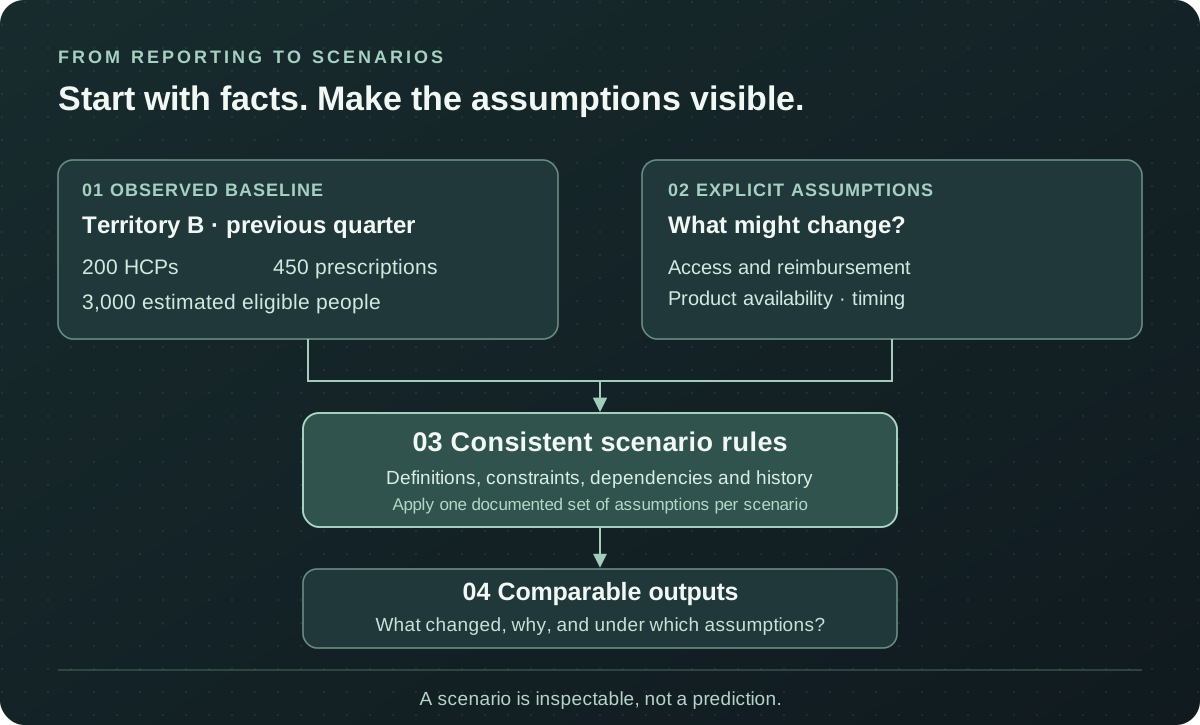
A useful scenario preserves the baseline, makes assumptions visible, and applies the same definitions across its outputs.
The distinction matters. Simply adding 20% to a spreadsheet total is a calculation. Exploring why prescriptions might change—and which other conditions would have to hold—is a scenario.
Three possible versions of next quarter
Imagine NovaMab’s team wants to explore three hypothetical conditions in Territory B.
In the reference case, market conditions remain broadly similar and the illustration uses 450 prescriptions.
In an improved-access case, coverage expands for some of the relevant population. For illustration, suppose the scenario produces 510 prescriptions, provided patients can access treatment and sufficient product is available.
In an availability-constrained case, temporary supply limitations restrict what can be dispensed. Suppose that scenario produces 390 prescriptions.
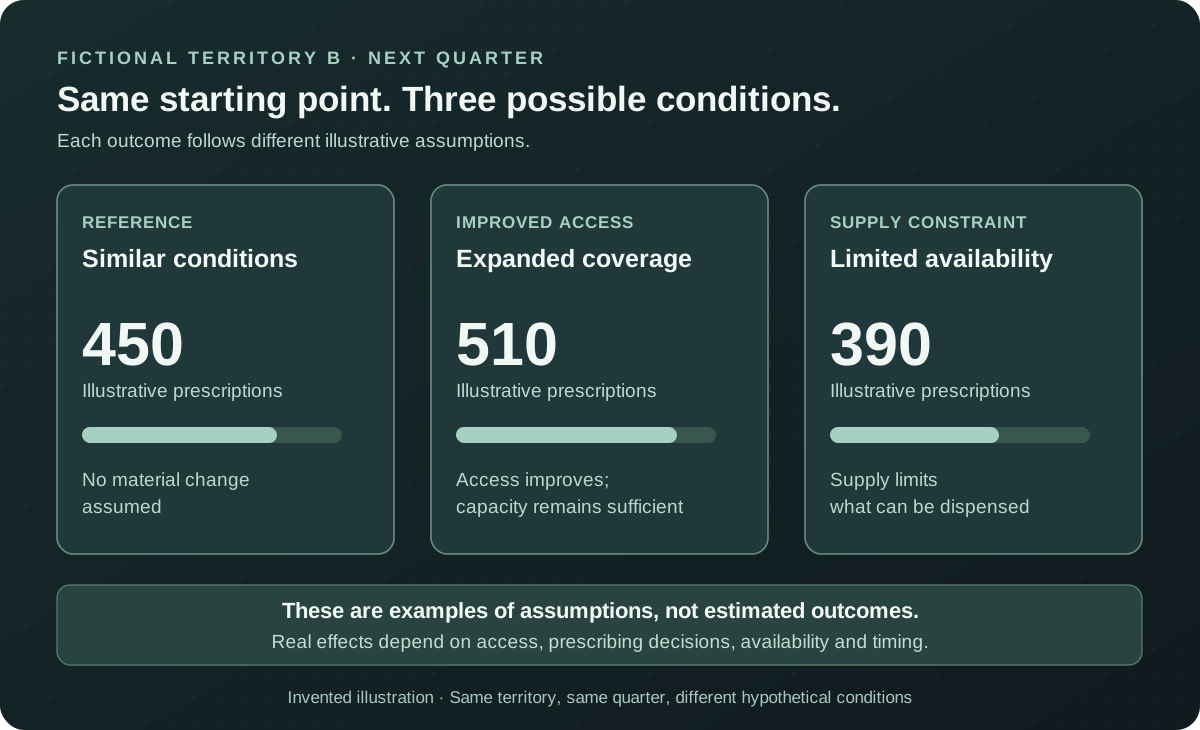
These values are invented to explain scenario comparisons. They were not generated by HealthSynth, estimated from real customers, or calculated as forecasts.
The numbers are less important than the questions they expose. If coverage improves but specialist capacity is limited, would the result change? If supply is constrained, how might availability affect dispensing? Would the effects appear immediately or over several quarters?
The purpose is to explore dependencies rather than present one attractive number as an inevitable outcome.
A scenario is more than a changed parameter
A meaningful scenario needs internally consistent assumptions.
Improved coverage does not automatically create eligible patients, guarantee treatment, or increase prescriptions in the same month. Prescribing decisions depend on clinical judgment, and access varies with the circumstances of individual patients.
Likewise, a supply interruption may constrain dispensing even when underlying demand remains unchanged. A report showing lower volume alone would not reveal that distinction.
If the fictional market includes competing products, an increase in NovaMab’s share should also be compatible with the way the rest of that market is defined. If the team changes territory assignments, historical comparisons should still use the appropriate assignments and dates.
A connected analytical foundation helps maintain these relationships. A scenario model adds explicit rules and assumptions on top of that foundation.
Neither eliminates uncertainty.
What scenarios can—and cannot—tell us
A scenario asks “What follows if these assumptions hold?” A forecast attempts to estimate what is likely to happen, using evidence and an appropriate method. They serve different purposes.
Our three fictional numbers are scenario illustrations, not probabilities, clinical outcomes, or predictions of commercial performance. Even a much more detailed model should show its assumptions, sensitivity to those assumptions, and the limitations of its source data.
That makes scenarios useful for planning discussions. Teams can compare the implications of improved access, delayed uptake, capacity limits, or changing market demand before deciding what additional evidence they need.
They should not use a simulated result as proof that a particular commercial activity caused prescribing changes, or assume that every technically possible combination of data is permissible to analyze.
The idea to take away
Historical analytics tells us what we observed. Connected analytics helps us examine that observation in context. Scenario analysis introduces a carefully defined possible change and follows its implications through the market.
A credible scenario is not a confident guess. It is an explicit set of assumptions that other people can inspect, challenge, and compare.
That raises one final question for our series: how can teams practise asking these questions, testing data pipelines, and examining connected market behaviour when real pharmaceutical customer data is unavailable, restricted, or inappropriate for the task?
Next: Can We Build a Pharmaceutical Market Without Real Customer Data?